Students can Download Maths Chapter 2 Algebra Additional Questions and Answers, Notes Pdf, Samacheer Kalvi 8th Maths Book Solutions Guide Pdf helps you to revise the complete Tamilnadu State Board New Syllabus and score more marks in your examinations.
Tamilnadu Samacheer Kalvi 8th Maths Solutions Term 2 Chapter 2 Algebra Additional Questions
![]()
Question 1.
A bus runs constantly at a speed of 60 km/hr. Draw a time-distance graph for the situation. Also find the
- Time taken to cover 360 km.
- Distance covered in 4\(\frac{1}{2}\) hours.
Solution:
Given the bus runs constantly at a speed of 60 km/hr.
i.e. for 1 hour = 60 km
2 hours = 2 x 60 = 120 km
3 hours = 3 x 60 = 180 km
We can tabulate as below,

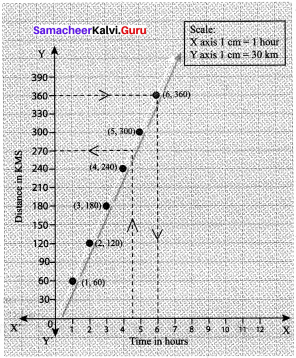
Take a suitable scale:
- Mark the number of hours on the x – axis
- Mark the distance in km on the y – axis
- Plot the points (1, 60), (2,120), (3, 180), (4, 240) and (5, 300)
- Join the points and get a straight line from the graph.
- Time taken to cover 360 km is 6 hours.
- Distance covered in 4\(\frac{1}{2}\) hours is

Question 2.
A company dealing with finance gives 15% simple interest on deposits made by senior citizens. Illustrate by a graph the relation between the deposit and the interest gained. Use the graph to complete the following.
- The annual interest obtainable for investment of ₹ 450
- The amount a senior citizen has to invest to get an annual simple interest of ₹ 100.
Solution:
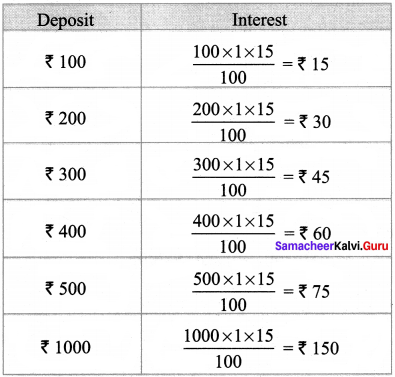
Using the formula for calculating the simple interest, the following table of values is prepared.


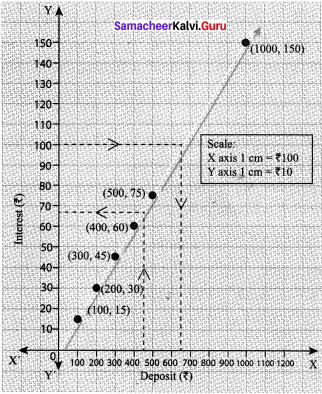
These are the points to be plotted in the graph sheet, let us take the deposits along x – axis and annual simple interest along y – axis.
We choose the scale as follows.
Then we plot the points and draw the straight line.
From the graph we find.
- Corresponding to ₹ 450 on the x – axis, we get the interest as ₹ 67.5 on the y – axis.
- Corresponding to ₹ 100 on the y – axis we get the deposit as ₹ 666 on the x – axis.

![]()
Question 3.
The following table gives the quantity of petrol and its cost

Plot the graph.
Solution:
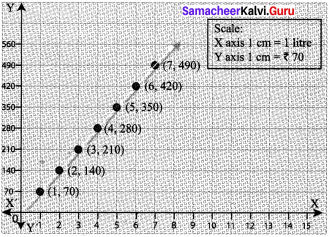
- Take a suitable scale on both the axes. Here we take on the x – axis
1 cm = 1 litre, on the y axis 1 cm = 70 rupees. - Mark number of litres of petrol along the x – axis
- Mark the cost of petrol along the y – axis.
- Plot the points (1, 70), (2, 140), (3, 210), (4, 280), (5, 350), (6, 420) and (7,490)
- Join the points.
The graph can help us to estimate few more things also.
