These Tamilnadu State Board Class 12th Economics Solutions Chapter 12 Introduction to Statistical Methods and Econometrics Questions and Answers help to enhance the skills. Download Solutions of Samacheer Kalvi 12th Economics Book Solutions Chapter Wise Pdf for free of cost. Refer Samacheer Kalvi Class 12th Economics Solutions pdf and kickstart your preparation. You can find the best Solutions for Samacheer Kalvi Class 12th Economics Solutions Chapterwise here.
Tamilnadu Samacheer Kalvi 12th Economics Solutions Chapter 12 Introduction to Statistical Methods and Econometrics
With the help of the Samacheer Kalvi Class 12th Economics Solutions Chapter 12 Introduction to Statistical Methods and Econometrics you can get an idea about the subject. The topics covered in Samacheer Kalvi Class 12th Economics Solutions Chapter 12 Introduction to Statistical Methods and Econometrics Solutions Questions and Answers. Tap the link and Download Samacheer Kalvi Class 12th Economics Solutions for Chapter 12 Introduction to Statistical Methods and Econometrics to cover all the topics.
Samacheer Kalvi 12th Economics Introduction to Statistical Methods and Econometrics Text Book Back Questions and Answers
Part – A
Multiple Choice Questions.
Question 1.
The word ‘statistics’ is used as ………………………
(a) Singular
(b) Plural
(c) Singular and Plural
(d) None of above
Answer:
(c) Singular and Plural
Question 2.
Who stated that statistics as a science of estimates and probabilities?
(a) Horace Secrist
(b) R. A Fisher
(c) Ya-Lun-Chou
(d) Boddington
Answer:
(d) Boddington
Question 3.
Sources of secondary data are …………………………..
(a) Published sources
(b) Unpublished sources
(c) Neither published nor unpublished sources
(d) Both (a) and (b)
Answer:
(d) Both (a) and (b)
Question 4.
The data collected by questionnaires are …………………………..
(a) Primary data
(b) Secondary data
(c) Published data
(d) Grouped data
Answer:
(a) Primary data
Question 5.
A measure of the strength of the linear relationship that exists between two variables is called …………………………..
(a) Slope
(b) Intercept
(c) Correlation coefficient
(d) Regression equation
Answer:
(c) Correlation coefficient
Question 6.
If both variables X and Y increase or decrease simultaneously, then the coefficient of correlation will be …………………………..
(a) Positive
(b) Negative
(c) Zero
(d) One
Answer:
(a) Positive
Question 7.
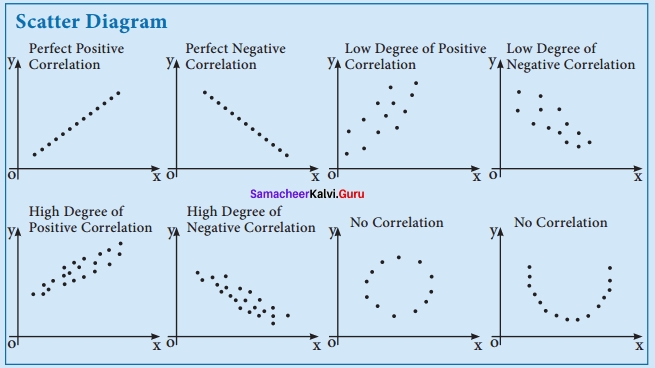
If the points on the scatter diagram indicate that as one variable increases the other variable tends to decrease the value of r will be …………………………..
(a) Perfect positive
(b) Perfect negative
(c) Negative
(d) Zero
Answer:
(c) Negative
Question 8.
The value of the coefficient of correlation r lies between …………………………..
(a) 0 and 1
(b) – 1 and 0
(c) – 1 and + 1
(d) – 0.5 and + 0.5
Answer:
(c) – 1 and + 1
Question 9.
The term regression was used by …………………………..
(a) Newton
(b) Pearson
(c) Spearman
(d) Galton
Answer:
(d) Galton
Question 10.
The purpose of simple linear regression analysis is to …………………………..
(a) Predict one variable from another variable
(b) Replace points on a scatter diagram by a straight-line
(c) Measure the degree to which two variables are linearly associated
(d) Obtain the expected value of the independent random variable for a given value of the dependent variable
Answer:
(a) Predict one variable from another variable
Question 11.
A process by which we estimate the value of dependent variable on the basis of one or more independent variables is called …………………………..
(a) Correlation
(b) Regression
(c) Residual
(d) Slope
Answer:
(b) Regression
Question 12.
If Y = 2 – 0.2X, then the value of Y intercept is equal to …………………………..
(a) -0.2
(b) 2
(c) 0.2X
(d) All of the above
Answer:
(b) 2
Question 13.
In the regression equation Y = β0 + β1 X, the Y is called …………………………..
(a) Independent variable
(b) Dependent variable
(c) Continuous variable
(d) None of the above
Answer:
(b) Dependent variable
Question 14.
In the regression equation X = β0 + β1 X, the X is called …………………………..
(a) Independent variable
(b) Dependent variable
(c) Continuous variable
(d) None of the above
Answer:
(a) Independent variable
Question 15.
Econometrics is the integration of …………………………..
(a) Economics and Statistics
(b) Economics and Mathematics
(c) Economics, Mathematics and Statistics
(d) None of the above
Answer:
(c) Economics, Mathematics and Statistics
Question 16.
Econometric is the word coined by …………………………..
(a) Francis Galton
(b) Ragnar Frish
(c) Karl Person
(d) Spearsman
Answer:
(b) Ragnar Frish
Question 17.
The raw materials of Econometrics are ……………………………
(a) Data
(b) Goods
(c) Statistics
(d) Mathematics
Answer:
(a) Data
Question 18.
The term Uiin regression equation is …………………………..
(a) Residuals
(b) Standard error
(c) Stochastic error term
(d) None
Answer:
(c) Stochastic error term
Question 19.
The term Uiis introduced for the representation of …………………………..
(a) Omitted Variable
(b) Standard error
(c) Bias
(d) Discrete Variable
Answer:
(a) Omitted Variable
Question 20.
Econometrics is the amalgamation of …………………………..
(a) 3 subjects
(b) 4 subjects
(c) 2 subjects
(d) 5 subjects
Answer:
(a) 3 subjects
Part – B
Answer The Following Questions In One or Two Sentences.
Question 21.
What is Statistics?
Answer:
Statistics may be defined as the collection, organization, presentation, analysis and interpretation of numerical data.
Question 22.
What are the kinds of Statistics?
Answer:
Types of Statistics:
1. There are two major types of statistics named as Descriptive Statistics and Inferential Statistics.
2. Descriptive Statistics:
The branch of statistics devoted to the summarization and description of data is called Descriptive Statistics.
3. Inferential Statistics:
The branch of statistics concerned with using sample data to make an inference about a population of data is called Inferential Statistics.
Question 23.
What do you mean by Inferential Statistics?
Answer:
Inferential Statistics:
The branch of statistics concerned with using sample data to make an inference about a population of data is called Inferential statistics.
Question 24.
What are the kinds of data?
Answer:
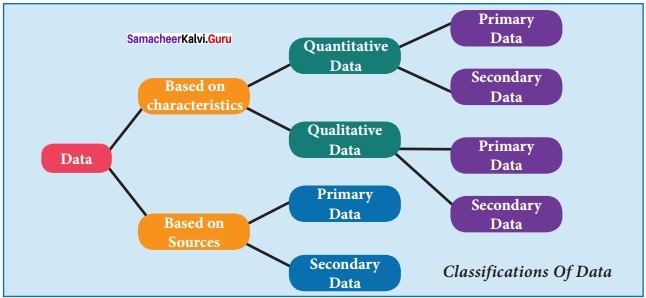
Question 25.
Define Correlation?
Answer:
Correlation is a statistical device that helps to analyse the covariation of two or more variables.
Question 26.
Define Regression?
Answer:
- The term ‘Regression’ was first coined and used in 1877 by Francis Galton while studying the relationship between the height of fathers and sons.
- The average height of children bom of parents of a given height tended to move or “regress” toward the average height in the population as a whole.
- Gabon’s law of universal regression was confirmed by his friend Karl Pearson, who collected more than a thousand records of heights of members of family groups.
- The literal meaning of the word “regression” is “Stepping back towards the average”.
Question 27.
What is Econometrics?
Answer:
The mutual penetration of quantitative econometric theory and statistical observation is the essence of Econometrics.
Econometrics – Economics + Statistics + Mathematics + Empirical Data.
Part – C
Answer The Following Questions In One Paragraph.
Question 28.
What are the functions of Statistics?
Answer:
- Statistics presents facts in a definite form.
- It simplifies the mass of figures.
- It facilitates comparison.
- It helps in formulating and testing.
- It helps in prediction.
- It helps in the formulation of suitable policies.
Question 29.
Find the Standard Deviation of the following data:
14, 22, 9, 15, 20, 17, 12, 11
∴ σ = 4.18
Question 30.
State and explain the different kinds of Correlation?
Answer:

Type I:
Based on the direction of change of variables:
Correlation is classified into two types as Positive correlation and Negative Correlation based on the direction of change of the variables.
Positive Correlation:
The correlation is said to be positive if the values of two variables move in the same direction.
Ex 1:
If income and Expenditure of a Household may be increasing or decreasing simultaneously. If so, there is positive correlation. Ex. Y = a + bx
Negative Correlation:
The Correlation is said to be negative when the values of variables move in the opposite directions. Ex. Y = a – bx
Ex 1:
Price and demand for a commodity move in the opposite direction.
Type II:
Based upon the number of variables studied
There are three types based upon the number of variables studied as
- Simple Correlation
- Multiple Correlation
- Partial Correlation
Simple Correlation:
If only two variables are taken for study then it is said to be simple correlation. Ex. Y = a + bx
Multiple Correlations:
If three or more than three variables are studied simultaneously, then it is termed as multiple correlation.
Ex: Determinants of Quantity demanded
Qd = f (P, Pc, Ps, t, y)
Where Qd stands for Quantity demanded, f stands for function.
P is the price of the goods,
Pc is the price of competitive goods
Ps is the price of substituting goods
t is the taste and preference
y is the income.
Partial Correlation:
If there are more than two variables but only two variables are considered keeping the other variables constant, then the correlation is said to be Partial Correlation.
Type III: Based upon the constancy of the ratio of change between the variables
Correlation is divided into two types as linear correlation and Non – Linear correlation based upon the Constancy of the ratio of change between the variables.
Linear Correlation:
Correlation is said to be linear when the amount of change in one variable tends to bear a constant ratio to the amount of change in the other.
Ex. Y = a + bx
Non-Linear:
The correlation would be non-linear if the amount of change in one variable does not bear a constant ratio to the amount of change in the other variables.
Ex. Y = a + bx2
Question 31.
Mention the uses of Regression Analysis?
Answer:
Use of Regression Analysis:
- Regression Analysis helps to study the relationship between the variables.
- It helps to indicate the cause and effect relationship between the variables and establishes a functional relationship.
- It is used for the prediction of one value, in relation to the other given value.
- It helps to study the linear and non-linear relationships between the variables.
Question 32.
Specify the objectives of econometrics?
Answer:
Objectives of Econometrics:
The general objective of Econometrics is to give empirical content to economic theory. The specific objectives are as follows:
- It helps to explain the behaviour of a forthcoming period that is forecasting economic phenomena.
- It helps to prove the old and established relationships among the variables or between the variables
- It helps to establish new theories and new relationships.
- It helps to test the hypotheses and estimation of the parameter.
Question 33.
Differentiate the economic model with the econometric model?
Answer:
- Models in Mathematical Economics are developed based on Economic theories, while, Econometric models are developed based on Economic theories to test the validity of Economic theories in reality through the actual data.
- Regression Analysis in statistics does not concentrate more on error term while econometric models concentrate more on error terms.
Question 34.
Discuss the important statistical organizations (offices) in India?
Answer:
- Official Statistics are statistics published by government agencies or other public bodies such as international organizations.
- They provide quantitative or qualitative information on all major areas of citizens’ lives.
- Official Statistics make information on economic and social development accessible to the public, allowing the impact of government policies to be assessed, thus improving accountability.
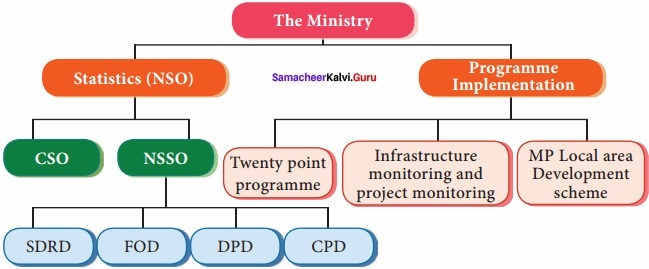
- The Ministry of Statistics and Programme Implementation (MOSPI) came into existence as an Independent Ministry in 1999 after the merging of the Department of Statistics and the Department of Programme Implementation.
- The Ministry has two wings, Statistics and Programme Implementation.
National Sample Survey Organisation (NSSO):
- The National Sample Survey Organisation, now known as National Sample Survey Office, is an organization under the Ministry of Statistic of the Government of India.
- It is the largest organisation in India, conducting regular socio-economic surveys.
- It was established in 1950. NSSO has four divisions:
- Survey Design and Research Division (SDRD)
- Field Operations Division (FOD)
- Data Processing Division (DPD)
- Co-ordination and Publication Division (CPD)
The Programme Implementation Wing has three Divisions, namely,
- Twenty Point Programme
- Infrastructure Monitoring and Project Monitoring
- Member of Parliament Local Area Development Scheme.
Besides these three wings, there is National Statistical Commission created through a Resolution of Government of India (MOSPI) and one autonomous Institute, viz., Indian Statistical Institute declared as an institute of National importance by an Act of Parliament.
Part – D
Answer The Following Questions.
Question 35.
Elucidate the nature and scope of Statistics?
Answer:
Nature of Statistics:
- Different statisticians and Economists differ in views about the nature of statistics,
some call it a science and some say it is an art. - Tippett on the other hand considers statistics both as a science as well as an art.
Scope of statistics:-
Statistics is applied in every sphere of human activity – Social as well as physical.
Statistics of Economics:-
Statistical data and .techniques are immensely useful in solving many economic problems such as fluctuation in wages, prices, production, distribution of income and wealth and so on.
Statistics and Firms:-
Statistics is widely used in many firms to find whether the product is conforming to specifications or not.
Statistics and commerce:-
Statistics are life blood of successful commerce. Market survey plays an import-ant role to exhibit the present conditions and to forecast the likely changes in future.
Statistics and Education:-
Statistics in necessary for the formulations of policies to start new course, accord¬ing to the changing environment.
Statistics and-planning:-
Statistics is indispensable is planning. In order to achieve the goals of the govern¬ment, various advanced statistical techniques are used for processing, analysing and interpreting data. In India statistics play an important role in planning.
Statistics and Medicine:-
In Medical Sciences, Statistical tools are widely used. More and more applica-tions of statistics are at present used in clinical investigation.
Statistics and Modern applications:-
Recent developments in the fields of computer and information technology have enabled statistics to integrate their models and thus make statistics a part of deci¬sion making procedures of many organizations.
Question 36.
Calculate the Karl Pearson Correlation Co-efficient for the following data?
Answer:

Question 37.
Find the regression equation Y on X and X on Y for the following data?
Answer:
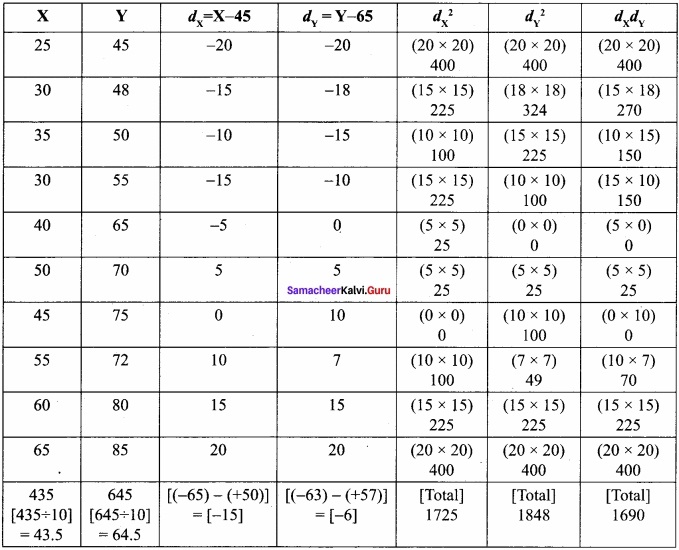

= \(\frac { 16810 }{ 17250-225 } \) = 1.01
X on Y
X – \(\bar { X } \) = bXy (Y – \(\bar { Y } \) )
X – 43.5 = 1.01 (Y – 64.5)
X – 43.5 = 1.01 Y – 65.145 [64.5 × 1.01]
X – 43.5 = 1.01 Y – 65.145
X – 43.5 = 0.01 Y – [65.145 – 43.5]
X = 0.01 Y – 21.645
Question 38.
Describe the application of Econometrics in Economics?
Answer:
Origin Of Econometrics:
- Economists tried to support their ideas with facts and figures in ancient times.
- Irving Fisher is the first person, developed a mathematical equations in the quantity theory of money with help of data.
- Ragnar Frisch, a Norwegian economist and statistician named the integration of three subjects such that mathematics, statistical methods and economics as Econometrics” in 1926. Ragnar Anton Kittil Frisch Noble Memorial Prize in 1969.
- The term econometrics is formed from two words of Greek origin, ‘oukovouia’ meaning economy and ‘uetpov’ meaning measure. Econometrics emerged as an independent discipline studying economics phenomena.
- Econometrics may be considered as the integration of economics, Statistics and Mathematics.
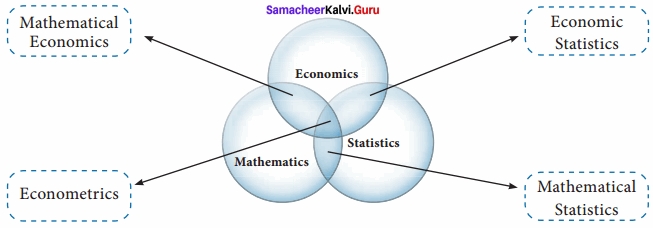
- Econometrics is an amalgamation of three subjects which can be easily understood by following Venn diagram and picture representation.
- Economics + Mathematics = Mathematical Economics
- Mathematical Economics + Statistical Data & Its Technique = Econometrics
- {Economics + Statistics + Mathematics} + Empirical Data = Econometrics
Definitions:
- In the words of Arthur S. Goldberger, “Econometrics may be defined as the social science in which the tools of economic theory, mathematics and statistical inference are applied to the analysis of economic phenomena”.
- Gerhard Tinbergen points out that “Econometrics, as a result of certain outlook on the role of economics, consists of application of mathematical statistics to economic data to lend empirical support to the models constructed by mathematical economics and to obtain numerical results”.
- H Theil“Econometrics is concerned with the empirical determination of economic laws”
- In the words of Ragnar Frisch “The mutual penetration of quantitative econometric theory and statistical observation is the essence of econometrics”.
- Econometrics means economic measurement. Econometrics deals with the measurement of economic relationships.
Objectives Of Econometrics:
The general objective of Econometrics is to give empirical content to economic theory. The specific objectives are as follows:
- It helps to explain the behaviour of a forthcoming period that is forecasting economic phenomena.
- It helps to prove the old and established relationships among the variables or between the variables.
- It helps to establish new theories and new relationships.
- It helps to test the hypotheses and estimation of the parameter.
Samacheer Kalvi 12th Economics Introduction to Statistical Methods and Econometrics Additional Questions and Answers
Part – A
I. Multiple Choice Questions.
Question 1.
The fundamental principles of statistics were developed by ……………..
a) Ragnar Fresh
b) Francis Galton
c) Ronald Fisher
d) Karl Pearson
Answer:
c) Ronald Fisher
Question 2.
The fundamental principles of statistics were developed by the biologist ………………………….
(a) Ronald Fisher
(b) Gottfried Achenwall
(c) R.A. Fisher
(d) GR Neison
Answer:
(a) Ronald Fisher
Question 3.
………………. is known as the founder of modern statistics,
a) Ronald Fisher
b) Ragner Frish
c) Karl Pearson
d) P.C. Mahalanobis
Answer :
d) P.C. Mahalanobis
Question 4.
The subjects of statistics can be attributed to ………………………….
(a) Francis GP. Neison
(b) Ronald Fisher
(c) Gottfried Achenwall
(d) R.A. Fisher
Answer:
(d) R.A. Fisher
Question 5.
To prepare a systematic study of birth and death related data is called ………………………….
(a) Principles of statistics
(b) Contributions of vital statistics
(c) Subject of statistics
(d) Statistics evolution
Answer:
(b) Contributions of vital statistics
Question 6.
…………………. data are those that can be quantified in definite units of measurement.
a) Qualitative
b) Nominal
c) Rank
d) Quantitative
Answer:
d) Quantitative
Question 7.
…………………………. form helps in the collection, presentation, classification, and interpretation of data make it easily comprehensible.
(a) Singular form
(b) Plural form
(c) Collection form
(d) Presentation form
Answer:
(a) Singular form
Question 8.
Statistics is applied in every sphere of ………………………….
(a) Physical activity
(b) Human activity
(c) Maths activity
(d) Statistics activity
Answer:
(b) Human activity
Question 9.
Statistical data and techniques are immensely useful in solving many …………………………. problems.
(a) Statistical
(b) Technical
(c) Economic
(d) Maths
Answer:
(c) Economic
Question 10.
The method of least squares is used to study ……………………….
a) Correlation
b) Regression
c) Standard deviation
d) Variance
Answer:
a) Correlation
Question 11.
In the modem world, which can be termed as the “World of planning”?
(a) Statistics
(b) Data
(c) Numerical data
(d) Five-year plan
Answer:
(a) Statistics
Question 12.
Since 2007, 29th June every year is celebrated as …………………………
(a) Economic day
(b) Data day
(c) Statistics day
(d) Planning day
Answer:
(c) Statistics day
Question 13.
In India, statistics play an important role of planning, both at the central and ……………………….. government levels.
(a) State
(b) Local
(c) District
(d) National
Answer:
(a) State
Question 14.
Statistical tools are widely used in …………………………..
(a) Statistical science
(b) Technical science
(c) Medical science
(d) Engineering science
Answer:
(c) Medical science
Question 15.
The branch of statistics devoted to the summarization and description of data is called ………………………… statistics.
(a) Descriptive
(b) Inferential
(c) Qualitative
(d) Quantitative
Answer:
(a) Descriptive
Question 16.
The branch of statistics concerned with using sample data is called ……………………… statistics.
(a) Descriptive
(b) Qualitative
(c) Descriptive
(d) Inferential
Answer:
(d) Inferential
Question 17.
…………………………. are those that can be quantified in definite units of measurement
(a) Quantitative
(b) Qualitative
(c) Descriptive
(d) Inferential
Answer:
(a) Quantitative
Question 18.
……………………….. is called a measure of central tendency or an average or a measure of location.
(a) Arithmetic mean
(b) Mean
(c) Cental value
(d) Geometric mean
Answer:
(c) Cental value
Question 19.
…………………….. is one of the methods of Absolute measure of dispersion.
(a) Standard Deviation
(b) Arithmetic mean
(c) Mean
(d) Median
Answer:
(a) Standard Deviation
Question 20.
…………………… is a statistical device that helps to analyse the covariation of two or more variables.
(a) Deviation
(b) Standard deviation
(c) Correlation
(d) Median
Answer:
(c) Correlation
Question 21.
………………………. The method is a very simple and non-mathematical method.
(a) Scatter Diagram
(b) Graphic
(c) Karl Pearson’s
(d) Actual mean
Answer:
(a) Scatter Diagram
Question 22.
The literal meaning of the word “Regression” is stepping back towards the …………………………….
(a) Standard deviation
(b) Mean deviation
(c) Average
(d) Median
Answer:
(c) Average
Question 23.
…………………………. may be considered as the integration of economics, statistics, and mathematics.
(a) Mathematical economics
(b) Statistical economics
(c) Technic economics
(d) Econometrics
Answer:
(d) Econometrics
Question 24.
The Central statistical office is one of the two – wings of the …………………………
(a) State statistical organization
(b) National statistical organization
(c) District statistical organization
(d) World statistical organization
Answer:
(b) National statistical organization
II. Match The Following And Choose The Correct Answer By Using the Codes Given Below.
Question 1.
A. Galton – (i) Principle of statistics
B. Ragnar Frisch – (ii) Regression
C. P.C. Mahalanobis – (iii) Econometrics
D. Ronald Fisher – (iv) Modem Statistics
Codes:
(a) A (i) B (ii) C (iii) D (iv)
(b) A (ii) B (iii) C (iv) D(i)
(c) A (iii) B (iv) C (i) D (ii)
(d) A (iv) B (i) C (ii) D (iii)
Answer:
(b) A (ii) B (iii) C (iv) D(i)
Question 2.
A. Statistics – (i) Solving economic problems
B. Statistical data – (ii) Successful commerce
C. Statistical tools – (iii) World of planning
D. Statistics lifeblood – (iv) Medical science
Codes:
(a) A (i) B (ii) C (iii) D (iv)
(b) A (ii) B (iv) C (i) D (iii)
(c) A (iii) B (i) C (iv) D (ii)
(d) A (iv) B (iii) C (ii) D(i)
Answer:
(c) A (iii) B (i) C (iv) D (ii)
Question 3.
A. Types of statistics – (i) Central value
B. Statistics data categories – (ii) Primary data
C. Collection of data – (iii) Central value
D. Measure of central tendency – (iv) Descriptive statistics
Codes:
(a) A (i) B (ii) C (ii) D (iv)
(b) A (iv) B (iii) C (ii) D(i)
(c) A (iii) B (i) C (iv) D (ii)
(d) A (ii) B (iv) C (i) D (iii)
Answer:
(b) A (iv) B (iii) C (ii) D(i)
Question 4.
A. Karl Pearson – (i) Regression
B. Measures of dispersion – (ii) Standard Deviation
C. Sir. Francis Galton – (iii) Absolute
D. Stepping back towards the average – (iv) Correlation
Codes:
(a) A (i) B (ii) C (iii) D (iv)
(b) A (iii) B (iv) C (i) D (ii)
(c) A (iv) B (i) C (ii) D (iii)
(d) A (ii) B (iii) C (iv) D(i)
Answer:
(d) A (ii) B (iii) C (iv) D(i)
Question 5.
A. NSSO – (i) 1999
B. MOSPI – (ii) 1877
C. Francis Galton – (iii) 1890 – 1962
D. R.A. Fisher – (iv) 1950
Codes:
(a) A (i) B (ii) C (iii) D (iv)
(b) A (iii) B (iv) C (i) D (ii)
(c) A (iv) B (i) C (ii) D (iii)
(d) A (ii) B (iii) C (iv) D (i)
Answer:
(c) A (iv) B (i) C (ii) D (iii)
Question 6.
A. Francis GP. Nelson – (i) England
B. Gottfried Achenwall – (ii) Contributions to vital statistics
C. Ronald Fisher – (iii) P.C. Mahalanobis
D. Modem statistics – (iv) Statistik
Codes:
(a) A (i) B (ii) C (iii) D (iv)
(b) A (iii) B (i) C (iv) D (ii)
(c) A (ii) B (iv) C (i) D (iii)
(d) A (iv) B (iii) C (ii) D(i)
Answer:
(c) A (ii) B (iv) C (i) D (iii)
III. Choose The Correct Statement:
Question 1.
(i) Statistics is indispensable planning.
(ii) In the modem world, it can be termed as the “World of planning”.
(a) Both (i) and (ii) are true
(b) Both (i) and (ii) are false
(c) (i) is true but (ii) is false
(d) (i) is false but (ii) is true
Answer:
(a) Both (i) and (ii) are true
Question 2.
(i) Statistical data and techniques are immensely useful in solving many economic problems.
(ii) Fluctuation in Inflation, Deflation.
(a) Both (i) and (ii) are true
(b) Both (i) and (ii) are false
(c) (i) is true but (ii) is false
(d) (i) is false but (ii) is true
Answer:
(c) (i) is true but (ii) is false
Question 3.
(i) Quantitative data are those that can be quantified in definite units of measurement.
(ii) These refer to characteristics in successive measurements that yield quantifiable observations.
(a) Both (i) and (ii) are true
(b) Both (i) and (ii) are false
(c) (i) is true but (ii) is false
(d) (i) is false but (ii) is true
Answer:
(a) Both (i) and (ii) are true
Question 4.
(i) Karl Pearson introduced the concept of Standard deviation.
(ii) Standard Deviation is one of the methods of Relative measure of dispersion.
(a) Both (i) and (ii) are true
(b) Both (i) and (ii) are false
(c) (i) is true but (ii) is false
(d) (i) is false but (ii) is true
Answer:
(c) (i) is true but (ii) is false
Question 5.
(i) The term econometrics is formed from two words of Greek origin, ‘Oukovovia’ meaning economy and ‘vetpov’ meaning measure.
(ii) Econometrics may be considered as the integration of economics, statistics, and mathematics.
(a) Both (i) and (ii) are true
(b) Both (i) and (ii) are false
(c) (i) is true but (ii) is false
(d) (i) is false but (ii) is true
Answer:
(a) Both (i) and (ii) are true
IV. Which of The Following Is Correctly Matched.
Question 1.
(a) Gottfried Achenwall – Statistics
(b) GP. Nelson – Contributions to vital statistics
(c) Ronald Fisher – Movemental contribution
(d) Modem statistics – Ronald Fisher
Answer:
(b) GP. Nelson – Contributions to vital statistics
Question 2.
(a) Quantitative data – Gender, community
(b) Qualitative data – Age, income
(c) Nominal data – Classification of students
(d) Rank data – Collection of data
Answer:
(c) Nominal data – Classification of students
Question 3.
(a) Central value – Measure of central tendency
(b) Dispersion – Average
(c) Standard Deviation – Ronald Fisher
(d) Sir Francis Galton – Graphic Method
Answer:
(a) Central value – Measure of central tendency
Question 4.
(a) Francis Galton – Stepping back towards the average
(b) Irving Fisher – Data
(c) Ragner Frisch – Technique
(d) Econometrics – Economy + Metrics
Answer:
(a) Francis Galton – Stepping back towards the average
Question 5.
(a) Arthur S. Gold Berger – Maths
(b) Gerhard Tinbergen – Social
(c) H. Theil – Economic laws
(d) Ragnar Frisch – Statistics
Answer:
(c) H. Theil – Economic laws
V. Which of The Following is Not Correctly Matched.
Question 1.
(a) Statistic Regression – Y1 = β0 + β1X1
(b) Econometrics Regression – Y1 = β0 + β1X1 + U1
(c) Regression lines – X on Y ⇒ X = a + by
(d) Actual Mean Method = \(\frac { \Sigma X }{ N } \)
Answer:
(d) Actual Mean Method = \(\frac { \Sigma X }{ N } \)
Question 2.
(a) SDRD – Survey Design and Research Division
(b) FOD – Field Operations Division
(c) DPD – Division Processing Data
(d) CPD – Co-Operation and Publication Division
Answer:
(c) DPD – Division Processing Data
Question 3.
(a) NSO – National Statistical Office
(b) CSO – Central Statistical Office
(c) NSSO – National Sample Survey Organisation
(d) NAD – National Arithematic Division
Answer:
(d) NAD – National Arithematic Division
Question 4.
(a) NAD – National Accounts Division
(b) SSD – Social Statistics Division
(c) ESD – Economic Social Division
(d) TD – Training Division
Answer:
(c) ESD – Economic Social Division
Question 5.
Answer:
VI. Pick The Odd One Out.
Question 1.
Functions of Statistics
(a) Statistics presents facts in a definite form
(b) It simplifies the mass of figures
(c) It helps firms
(d) It helps in formulating and testing
Answer:
(c) It helps firms
Question 2.
Based upon the number of variables studied as
(a) Simple correlation
(b) Multiple correlations
(c) Partial correlation
(d) Linear correlation
Answer:
(d) Linear correlation
Question 3.
Methods of studying the correlation
(a) Scatter diagram method
(b) Graphic method
(c) Maths method
(d) Method of least squares
Answer:
(c) Maths method
Question 4.
NSSO divisions are
(a) Survey Design and Research Division [SDRD]
(b) Fashion Operation Division [FOD]
(c) Data Processing Division [DPD]
(d) Coordination and Publication Division [CPD]
Answer:
(b) Fashion Operation Division [FOD]
Question 5.
CSO Director Generals are
(a) National Accounts Division [NAD]
(b) Sample Statistics Division [SSD]
(c) Economic Statistics Division [ESD]
(d) Co – ordination and Publication Division [CPD]
Answer:
(b) Sample Statistics Division [SSD]
VII. Assertion and Reason.
Question 1.
Assertion (A): The monumental contribution to the subject of statistics can be attributed to R.A. Fisher was able to apply statistics to a variety.
Reason (R): Fields such as Biometry, Genetics, Psychology, Education, Agriculture, and others.
(a) Both ‘A’ and ‘R’ are true and ‘R’ is the correct explanation to ‘A’
(b) Both ‘A’ and ‘R’ are true but ‘R’ is not the correct explanation for ‘A’
(c) ‘A’ is true but ‘R’ is false
(d) ‘A’ is false but ‘R’ is true
Answer:
(a) Both ‘A’ and ‘R’ are true and ‘R’ is the correct explanation to ‘A’
Question 2.
Assertion (A): In singular form, it simply means simple method.
Reason (R): Singular forms help in the collection, presentation, classification, and interpretation of data.
(a) Both ‘A’ and ‘R’ are true and ‘R’ is the correct explanation to ‘A’
(b) Both ‘A’ and ‘R’ are true but ‘R’ is not the correct explanation to ‘A’
(c) ‘A’ is true but ‘R’ is false
(d) ‘A’ is false but ‘R’ is true
Answer:
(d) ‘A’ is false but ‘R’ is true
Question 3.
Assertion (A): Statistics is indispensable in planning.
Reason (R): In the modem world, which can be termed as the “World of Planning” almost all organizations.
(a) Both ‘A’ and ‘R’ are true and ‘R’ is the correct explanation to ‘A’
(b) Both ‘A’ and ‘R’ are true but ‘R’ is not the correct explanation to ‘A’
(c) ‘A’ is true but ‘R’ is false
(d) ‘A’ is false but ‘R’ is true
Answer:
(a) Both ‘A’ and ‘R’ are true and ‘R’ is the correct explanation to ‘A’
Question 4.
Assertion (A): Quantitative data are those that can be quantified in definite units of measurement.
Reason (R): These refer to characteristics of a subject or an object.
(a) Both ‘A’ and ‘R’ are true and ‘R’ is the correct explanation to ‘A’
(b) Both ‘A’ and ‘R’ are true but ‘R’ is not the correct explanation to ‘A’
(c) ‘A’ is true but ‘R’ is false
(d) ‘A’ is false but ‘R’ is true
Answer:
(c) ‘A’ is true but ‘R’ is false
Question 5.
Assertion (A): Ronald Fisher introduced the concept of Standard Deviation.
Reason (R): Standard Deviation is one of the methods of Absolute measure of dispersion.
(a) Both ‘A’ and ‘R’ are true and ‘R’ is the correct explanation to ‘A’
(b) Both ‘A’ and ‘R’ are true but ‘R’ is not the correct explanation for ‘A’
(c) ‘A’ is true but ‘R’ is false
(d) ‘A’ is false but ‘R’ is true
Answer:
(d) ‘A’ is false but ‘R’ is true
Part – B
Answer The Following Questions In One or Two Sentences.
Question 1.
Name the kinds of measures of Dispersion.
Answer:
- Absolute measure of dispersion
- Relative measure of dispersion
Question 2.
Write the meaning of averages?
Answer:
- “A measure of central tendency is a typical value around which other figures congregate.”
- “An average stands for the whole group of which it forms a part yet represents the whole.”
- “One of the most widely used set of summary figures is known as measures of location.”
Question 3.
List the advantages of scatter- Diagram method.
Answer:
- It is a very simple and non-mathematical method
- It is not influenced by the size of an extreme item.
- It is the first step in resting the relationship between two variables.
Question 4.
Explain the calculation of standard deviation individual series?
Answer:
Calculation of Standard deviation-individual Series:
There are two methods of calculating Standard deviation in an individual series.
(a) Deviations took from Actual mean
(b) Deviation taken from Assumed mean
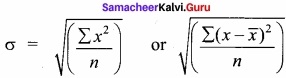
Standard Deviation = 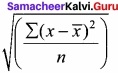
Where, \(\bar { X } \) = mean value of distribution
n = number of observations
Question 5.
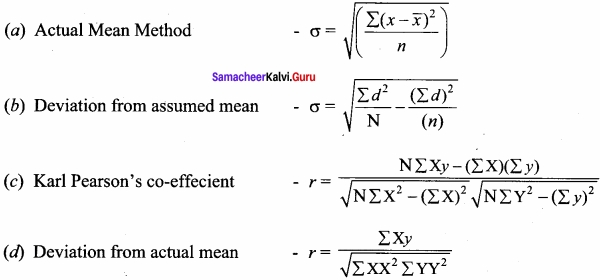
Write the four methods of studying correlation?
Answer:
Methods of Studying Correlation:
The various methods of ascertaining whether two variables are correlated or not are:
- Scatter diagram Method
- Graphic Method
- Karl Pearson’s Co-efficient of correlation and
- Method of Least Squares.
Question 6.
What is Data?
Answer:
Data is the information about facts or numbers collected to be examined and used to help with decisions.
Question 7.
Write the two regression lines?
Answer:
Two Regression lines:
X on Y => X = a + by
Y on X => Y = a + bx
Question 8.
Write a flow chart of the Anatomy/Methodology of Econometrics?
Answer:
Flow Chart of Anatomy / Methodology of Econometrics:
Anatomy of Econometric Modeling
Question 9.
Explain the statistics and econometrics regression equations?
Answer:
Statistics Regression:
Yi = β0 + β1X1
Econometrics Regression:
Yi = β0 + β1Xi + Ui
(with more than 2 variables) or
Y = β0 + β1X1 + β2X2 + β3X3 + Ui
- Systematic Part: β0 + β1X1 or explained part and Random Part: Uf unexplained part in a regression.
- Ui represents the role of omitted variables in specifying a regression relationship of Y on X.
- Hence, the Ui cannot and should not be ignored.
Part – C
Answer The Following Questions In One Paragraph.
Question 1.
Explain the sources of collection of data?
Answer:
Sources of Collection of data:
Based on the data sources, data could be seen as of two types, viz., secondary data and primary data. The two can be defined as under:
(I) Primary data:
- Those data do not already exist in any form, and thus have to be collected for the first time from the primary source(s).
- By their very nature, these data are fresh and first-time collected covering the whole population or a sample drawn from it.
(II) Secondary data:
- They already exist in some form: published or unpublished in an identifiable secondary source.
- They are, generally, available from a published source(s), though not necessarily in the form actually required, e.g. Data from CSO, NSSO, RBI.
Question 2.
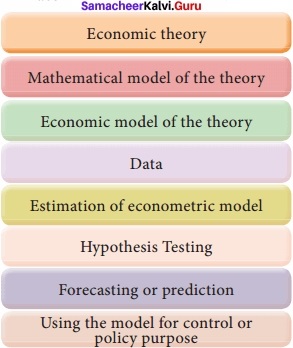
Explain the anatomy of Econometric modeling.
Answer:
- Economic theory
- Mathematical model of the theory
- The economic model of the theory
- Data
- Estimation of an econometric model
- Hypothesis Testing
- Forecasting or prediction
- Using the model for control or policy purpose.
Question 3.
Briefly explain the calculation of standard deviation individual series steps?
Answer:
Steps:
- Find out the actual mean of given data ( \(\bar { X } \) )
- Find out the deviation of each value from the mean (x = X – \(\bar { X } \) )
- Square the deviations and take the total of squared deviations Σx2
- Divided the total Σx2 by the number of observation ( \(\frac { \Sigma x^{ 2 } }{ n } \) )
- The square root of ( \(\frac { \Sigma x^{ 2 } }{ n } \) ) is standard deviation.
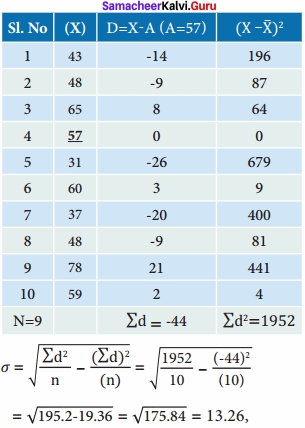
\(\frac { \Sigma x^{ 2 } }{ n } \) = Variance = \(\frac { \Sigma (x-\bar { x } )^{ 2 } }{ n } \)
When the sample size is less than 30, variance = \(\frac { \Sigma (x-\bar { x } )^{ 2 } }{ n-1 } \)
When n = number of observations.
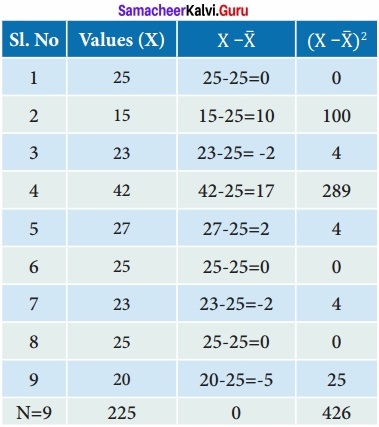
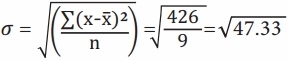
Question 4.
Calculate the standard deviation from the following data by Actual Mean Method?
125, 15, 23, 42, 27, 25, 23, 25 and 20
Solution:
Deviations from actual mean.
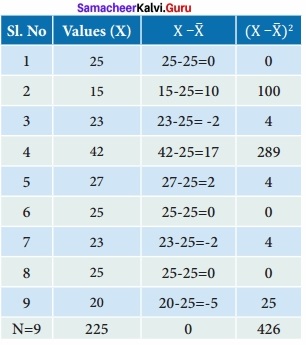
\(\bar { X } \) = \(\frac{225}{9}\) = 25
σ = 6.88
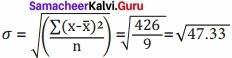
Question 5.
Calculate the standard deviation for the following data by assumed mean method?
[43, 48, 65, 57, 31, 60, 37, 48, 78, 59]
Solution:
Deviation from assumed mean
Question 7.
Explain the type of correlation-based upon the number of variables studied.
Answer:
- A simple correlation of only two variables is taken for study then it is said to be a simple, correlation.
- Multiple correlations: If three or more than three variables are studied simultaneously, then it is termed as multiple correlations.
- Partial correlation: If there are more than two variables but only two variables are considered keeping the other variables constant, then the correlation is said to be a partial correlation.
Part – D
Answer The Following Questions In About A Page.
Question 1.
Explain the Scatter Diagram Method. Advantages and Disadvantages with diagram?
Answer:
Scatter Diagram Method:
- A Scatter diagram is a graph of observed plotted points where each point represents the values of X and Y as a coordinate.
- It portrays the relationship between these two variables graphically.
Advantages of the Scatter Diagram method:
- It is the very simple and non-mathematical method
- It is not influenced by the size of an extreme item.
- It is the first step in resting the relationship between two variables.
Disadvantages of Scatter diagram method:
- It cannot establish the exact degree of correlation between the variables, but provides the direction of correlation and depicts it is high or low.
Question 2.
Briefly explain Karl Pearson’s coefficient of correlation?
Answer:
Karl Pearson’s Coefficient of Correlation:
- Karl Pearson’s Method is popularly known as Pearson’s coefficient of correlation denoted by the symbol V.
- The coefficient of correlation V measures the degree of the linear relationship between two variables say X and Y.
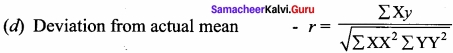
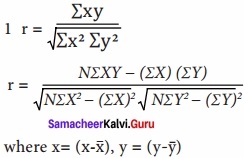
- The Formula for computing Karl Pearson’s Coefficient of correlation is:
(I)
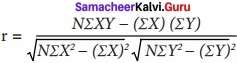
‘r’ is calculated by Direct Method without taking deviation of terms either from the actual mean or assumed mean.
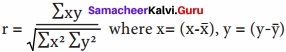
(II) r is calculated by taking the Deviation from the actual mean.
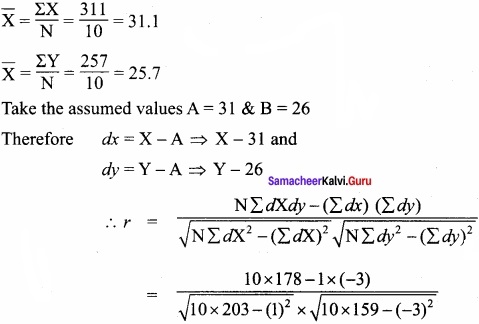
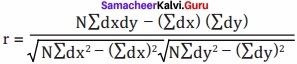
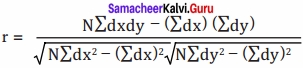
(III) ‘r’ is caluculated by taking assumed mean

Where dx refers to deviations ofx series from assumed mean (x – \(\bar { x } \) ), dy refers to deviations of y series from an assumed mean of (y – \(\bar { y } \) )
Σdxdy = Sum of the product of the deviations x and y series from their assumed means.
Σdx2 = Sum of the squares of the deviation of x series from an assumed mean
Σdy2 = Sum of the squares of the deviations of y series from an assumed mean
Σdx = Sum of the deviation of x series from an assumed mean of x
Σdy = Sum of the deviation of y series from an assumed mean of y
Question 3.
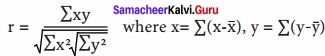
Explain the procedure for computing the correlation co – effecient for direct and deviation from actual mean method steps?
Answer:
Procedure for Computing the Correlation Coefficient: (For Direct and Deviation from the actual mean method).
- Step – 1 Calculate the mean of two series ‘X’ ‘Y’
- Step – 2 Calculate the deviations ‘X’ and Y in two series from their respective mean.
- Step – 3 Square each deviation of ‘X’ and ‘ Y’ then obtain the sum of the Squared deviation
- Step – 4 Multiply each deviation under X with each deviation under Y and obtain the product of ‘xy’. Then obtain the sum of the product of X, Y. Then obtain the sum of the product of x, y is Σxy.
- Step – 5 Substitute the value in the formula.
Question 4.
State the formula of Karl Pearson’s co – effecient of correlation ungrouped data?
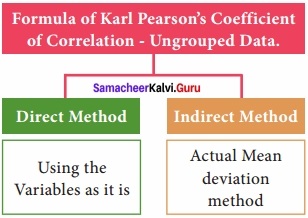
1. Direct Method:
(I)
(II) Assumed Mean Deviation Method
2. Indirect Method:
dx = (x – \(\bar { x } \) ) and dy = (y – \(\bar { y } \) )
r is free from origin
r is free from unit of measurement -1 ≤ r ≤ + 1
Question 5.
Calculate Karl Pearson’s Coefficient of correlation from the following data and interpret its value:
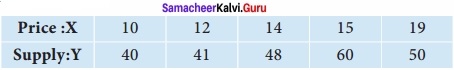
Solution: Let us take Price as X and supply as Y
Computation of Pearson’s Correlation Coefficient:
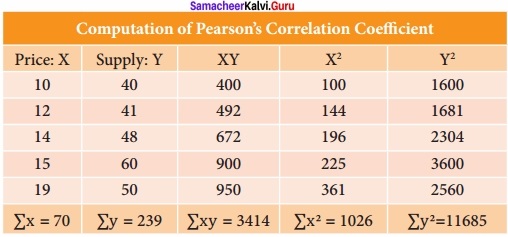

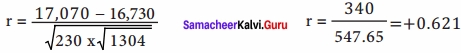
The price of the product and supply for the product is positively correlated. When the price of the product increases then the supply for the product also increases.
Question 6.
Estimate the coefficient of correlation with an actual mean method for the following data?
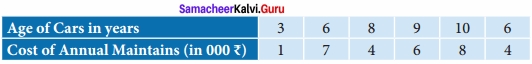
Solution:
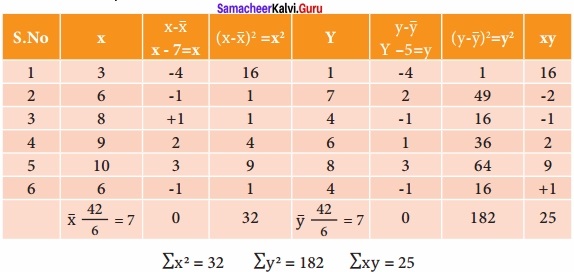
Applying in Formula
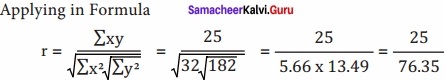
r = 0.327, The Car is getting old in years the cost of maintenance is also increasing. The age of Car and its maintenance are positively correlated.
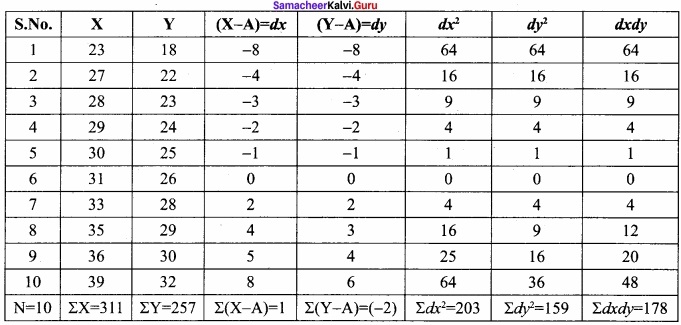
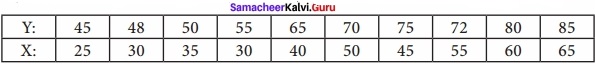
Question 7.
Find the Karl Pearson coefficient of Correlation between X and Y from the following data:

Solution:
The formula for Assumed Mean Deviation method.
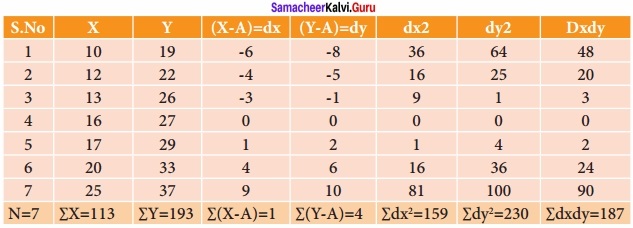
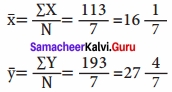
Take the assumed values A = 16 & B = 27 therefore dx = X – A ⇒ X – 16 and
dy = Y – A ⇒ Y = 27

There exists a positive high correlation between X and Y.
Question 8.
Mention the assumptions of the Linear Regression Model.
Answer:
The linear regression model is based on certain assumptions.
- Some of them refer to the distribution of the random variable.
- Some of them refer to the relationship between Ui and the explanatory variables.
- Some of them refer to the relationship between Ui the explanatory variables themselves.
Assumptions about the distribution of the values are called stochastic assumptions of ordinary least squares (OLS)
Assumptions relating to the relationship between and explanatory variables and relating to the relationship among the explanatory variables are called other assumptions.
Assumptions:
- ‘U’ is a random real variable. That is ‘U’ may assume positive, negative or zero values. Hence the mean of the ‘U’ will be zero.
- The variance of ‘U’ is constant for all values of ‘U’.
- The ‘U’ has a normal distribution.
- The covariances of any Ui with any other Ui are equal to zero.
- ‘U’ is independent of the explanatory variable (s)
- Explanatory variables are measured without error.
- The explanatory variables are not perfectly linearly correlated.
- The variables are correctly aggregated.
- The relationship is correctly identified and specified.
- Parameters are linear.
Question 9.
Explain Fit the Regression equation on [X on Y]?
Answer:
Fit regression equation X on Y and Y on X for the following data.
\(\bar { X } \) = 12, \(\bar { Y } \) = 10, σy = 0.2, σx = 0.1 and r = 0.85
Solution:
The regression X on Y is
(X – \(\bar { X } \) ) r = r × \(\frac{σx}{σy}\) × (X – \(\bar { X } \) )
Given \(\bar { X } \) = 12, \(\bar { Y } \) = 10
r = 0.85, σx = 0.1 and σy = 0.2
Then substituting the values in formula
(X – 12) = 0.85 × (0.1/0.2) × (Y – 10)
(X – 12) = 0.85 × (0.5) × (Y – 10)
X = 0.425 × (Y – 10) + 12
X = 0.425 Y – 4.25 + 12
X = 0.425 Y + 7.75
Y on X
Y = 0.425 Y + 7.75
Question 10.
Explain Fit the Regression equation on [Y on X]?
Answer:
The regression Y on X is
(Y – \(\bar { Y } \) ) r = r × \(\frac{σx}{σy}\) × (X – \(\bar { X } \) )
Given \(\bar { X } \) = 12, \(\bar { Y } \) = 10
r = 0.85, σx = 0.1 and σy = 0.2
Then substituting the values in formula
(Y – 10) = 0.85 × (0.2/0.1) × (X – 12)
(Y – 10) = 0.85 × (2) × (X – 12)
Y = 1.7 × (X – 12) + 10
Y = 1.7 X – 20.4 + 10
Y = 1.7 X – 10.4
Y on X
Y = 1.7 X – 10.4
Question 11.
Briefly, explain the Methodology of Econometrics?
Answer:
The methodology of Econometrics:
Broadly speaking, the traditional or classical econometric methodology consists of the following steps.
- Statement of the theory or hypothesis
- Specification of the mathematical model of the theory
- Specification of the econometric model of the theory
- Obtaining the data
- Estimation of the parameters of the econometric model
- Hypothesis testing
- Forecasting or prediction
- Using the model for control or policy purposes.
Question 12.
Explain the explanatory variables Assumptions?
Answer:
The explanatory variables are called assumptions.
Assumptions:
- “U” is a random real variable. That is “U” may assume positive, negative, or zero values. Hence the mean of the “U” will be zero.
- The variance of “U” is constant for all values of “U”
- The “U” has a normal distribution.
- The Covariances of any U. with any other U are equal to zero
- “U” is independent of the explanatory variable (s)
- Explanatory variables are measured without error.
- The explanatory variables are not perfectly linearly correlated.
- The variables are correctly aggregated.
- The relationship is correctly identified and specified.
- Parameters are linear.
Question 13.
Explain the flow chart of statistics and programme implementation of the Ministry wings?
Answer:
The Ministry has two wings, Statistics and Programme Implementation
The main aim is to provide quality education for the students of Class 12th is very important for the students in their career. We hope the information provided in this Samacheer Kalvi Class 12th Economics Solutions Chapter 12 Introduction to Statistical Methods and Econometrics Questions and Answers is satisfactory for all. Bookmark our site to get the latest information about the solutions.