Students can Download Maths Chapter 4 Statistics Additional Questions and Answers, Notes Pdf, Samacheer Kalvi 8th Maths Book Solutions Guide Pdf helps you to revise the complete Tamilnadu State Board New Syllabus and score more marks in your examinations.
Tamilnadu Samacheer Kalvi 8th Maths Solutions Term 3 Chapter 4 Statistics Additional Questions
Question 1.
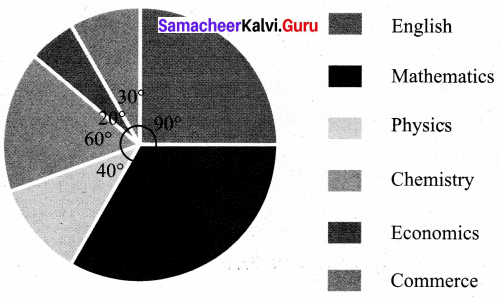
The following information shows the number of students opting different subjects in a college.
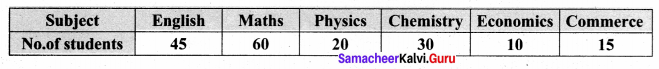
Draw a pie-chart to represent the information.
Solution:
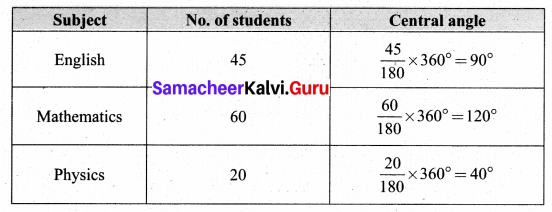
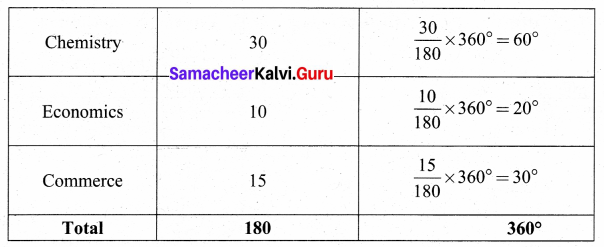
![]()
Students opting different subjects.
Question 2.
The pie chart represents the expenditures of a family on different items. Find the percentage expenditures on different items by reading the pie-chart.
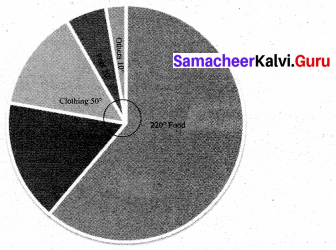
Solution:
Percentage value of the component = 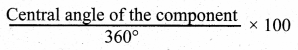
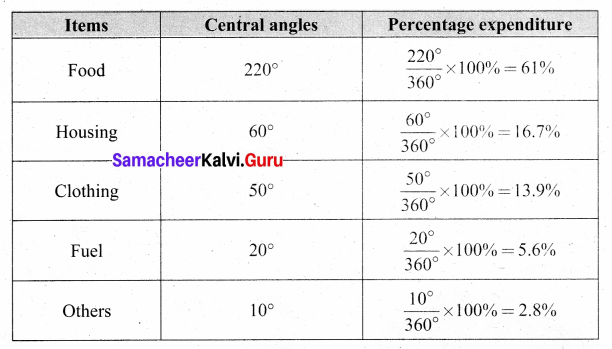
∴ Percentage expenditures on various items are given as :
![]()
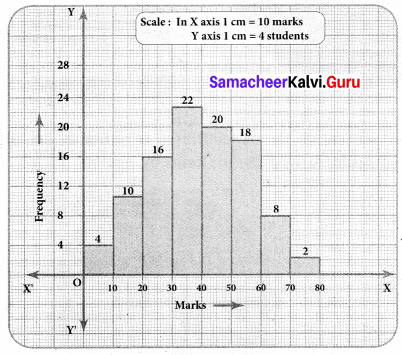
Question 3.
The following table gives the marks of 100 students represent in the form of a histogram.
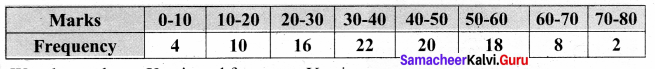
Solution:
We take marks on X axis and frequency Y axis.